Whitepaper – sTCC/sC5b-9 complement
The sTCC ELISA is a highly specific assay for quantifying terminal complement activation via sTCC in human plasma and serum. It enables reliable assessment of complement activity, supporting disease monitoring, pharmacodynamics, and complement-targeted therapy development. Discover in our white paper how sTCC/sC5b-9 provides a reliable marker for complement activation.
Reliable assessment of sTCC/sC5b-9; a useful marker for assessing complement activation
Abstract
The complement system is a critical component of innate immunity, with terminal complement activation culminating in the formation of the membrane attack complex (MAC) or its soluble counterpart, the soluble Terminal Complement Complex (sTCC, also known as sC5b-9). Dysregulation of terminal pathway activation is implicated in a range of inflammatory and autoimmune diseases, including systemic lupus erythematosus (SLE), atypical hemolytic uremic syndrome (aHUS), and transplant rejection. As quantifying sTCC levels offers crucial insight into complement activation status, it has emerged as a potential biomarker for disease onset, severity, prognosis, and response to complement-targeted therapies. In addition, sTCC quantification enables pharmacodynamic monitoring of complement inhibitors, making it a valuable marker in the development of novel drugs targeting complement mediated diseases. Here, we describe the development of the sTCC ELISA (cat.# HK328), a highly specific and reliable immunoassay for quantifying sTCC in human plasma and serum. The assay utilizes the neoepitopespecific monoclonal antibody aE11 to selectively capture activated C9 incorporated into sTCC, enabling precise measurement of the endpoint of terminal complement activation. Assay performance was thoroughly evaluated, demonstrating good sensitivity, specificity, recovery, linearity, and reproducibility across various matrices. Altogether, the sTCC ELISA provides a standardized, well-characterized assay for reliable assessment of terminal complement activation, supporting both mechanistic studies and clinical decision-making in the context of complement-driven diseases.
¹Research and Development Department, Hycult Biotech, Uden, The Netherlands
#These authors contributed equally to this study
Quick links


Download the white paper by filling out the form below:
18-page whitepaper | Includes assay performance data and protocol summary.
Fill in the form to get instant access to the PDF and a print-ready version of all figures and tables.
Introduction
The complement system is a key component of innate immunity. First described in the late 19th century by Jules Bordet, it was found that blood serum contains factors enhancing antibodymediated bacterial lysis. Later research identified terminal complement complex (TCC) formation as the final step of complement activation (1-3). The
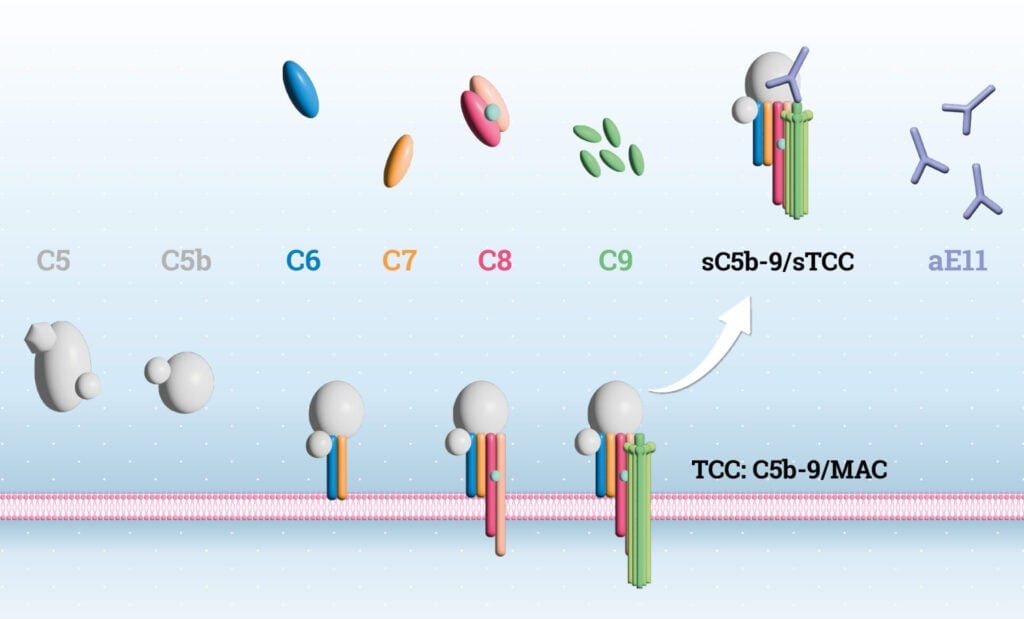
cascade involves ~50 proteins and is triggered via the classical, lectin, alternative, or indirectly via the extrinsic coagulation pathway. Beyond pathogen elimination through TCC-mediated lysis, the complement system plays roles in autoimmune and inflammatory diseases such as SLE, AMD, and transplant rejection (4, 5), and also influences adaptive immunity. Activation leads to formation of the C3 convertase, which propagates the cascade to generate C5b via the C5 convertase. C5b marks the start of the terminal pathway (TP), leading to assembly of the C5b-9 complex (6, 7), which exists as a membranebound variant (MAC) or soluble form (sTCC). TCC forms a barrel-shaped pore in membranes, driving cell lysis (8). The terminal complement complex (TCC), or MAC, is a critical effector that forms pores in target membranes. Its assembly is tightly regulated and irreversible, involving C5b, C6, C7, C8, and multiple C9 molecules (9). Following C5 cleavage, unstable C5b binds C6 to form C5b6, which then recruits C7, triggering conformational changes that expose hydrophobic domains, enabling membrane binding. This is followed by C8, a heterotrimer (C8α, C8β, C8γ), where C8α contains a membrane attack complex/perforin (MACPF) domain responsible for insertion into the lipid bilayer (10). This stabilizes the complex and allows up to 18 C9 molecules to polymerize, forming a transmembrane β-barrel pore. Cryo-electron microscopy has shown that MAC adopts a unique “split-washer” configuration, contributing to its asymmetric structure (11, 12). MAC pore formation disrupts membrane integrity, inducing cell lysis via uncontrolled ion exchange and osmotic imbalance. At sublytic levels, MAC also triggers intracellular signaling affecting survival, proliferation, and inflammation (13). While vital for defense against Gram-negative bacteria, dysregulated MAC activity contributes to autoimmune and inflammatory pathology (14). Due to the inefficiency of membrane insertion, a soluble, non-lytic form of the complex, namely sTCC, is often released, representing failed MAC assembly (8, 14, 15) (Figure 1). In recent years it became apparent that sTCC is a valuable biomarker for assessing terminal complement activation in complement-mediated diseases and for monitoring treatment response in patients receiving complement inhibitors (16-18). However, in order to do so, sensitive and reliable quantification of sTCC is essential. To quantify complement activation, various immunoassays have been developed, typically employing monoclonal antibodies that detect neo-epitopes present only in activation products. One such antibody, aE11 (HM2167), binds a C9 neo-epitope exposed only in TCC or poly-C9 (19). This ensures that the aE11 antibody specifically recognizes the assembled TCC complex, but not its individual components. To specifically measure terminal pathway activation, aE11 is incorporated in several sTCC and pathway ELISAs (e.g., HK328, HK3010/3012) (20). Here, we present data demonstrating that HK328 enables accurate, sensitive, and reproducible quantification of sTCC in plasma and serum, supporting its application as a well-characterized assay for assessing terminal complement activation in both research and clinical settings, including drug development and therapeutic response monitoring.
Box 1.
Harmonizing Bioanalytical Method Validation: The ICH M10 Guideline
About ICH M10
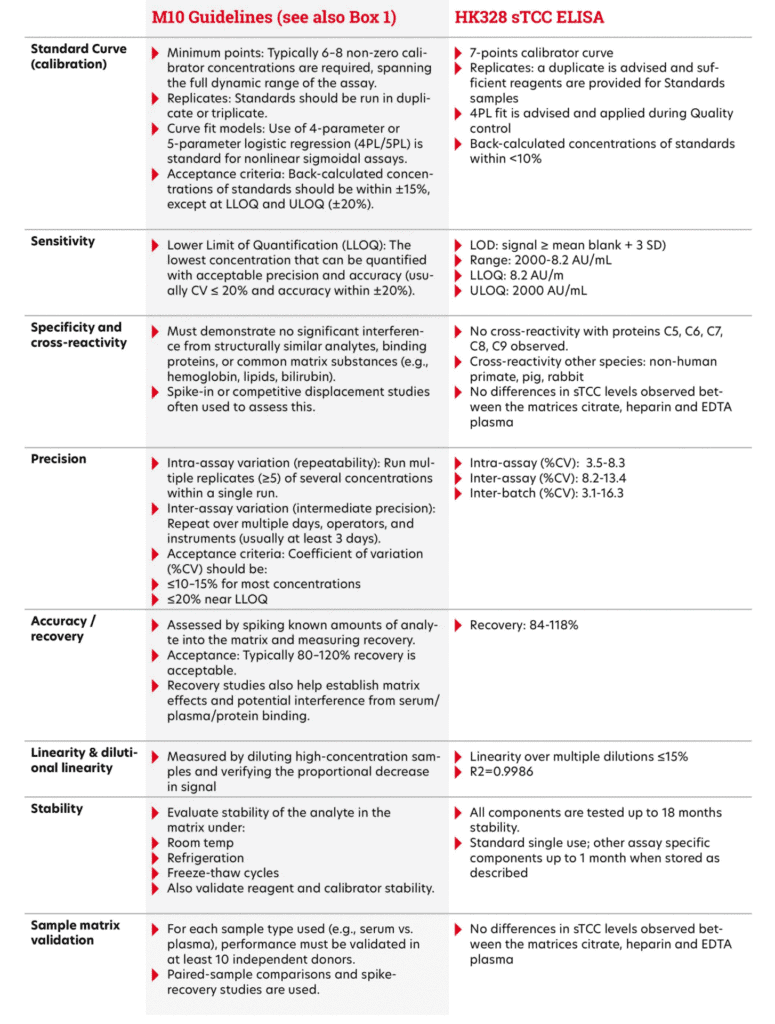
The ICH M10 Guideline sets global standards for how bioanalytical methods, like ELISAs or chromatographic assays, should be validated and used in drug studies. It replaces older guidelines from the FDA and EMA to create one clear, harmonized approach. M10 covers key aspects such as calibration curves, accuracy, precision, selectivity, matrix effects, and sample stability. The goal is to ensure reliable results when measuring drugs or biomarkers in clinical and non-clinical samples. Up-to-date guidelines can be downloaded at https://www.ema.europa.eu/en/ich-m10-bioanalyticalmethod-validation-scientific-guideline. By following M10, labs around the world can work more consistently, reduce repeat work, and support faster drug development. An ELISA validated according to ICH M10 Guidelines ensures reliable, reproducible, and regulatory-compliant data on analyte concentrations in biological matrices, which is essential for drug development and decision-making. Extra documents from the EMA and FDA help with practical details like use of animal-free matrices or bioequivalence studies. In the table 1 below, we show how our assay compares to the main points of the ICH M10 guideline.
The Hycult Biotech human sTCC assay (HK328) recognizes the soluble part of TCC, sTCC.
Materials and methods
Biological samples
Human CHES panels (citrate, heparin, EDTA plasma and serum samples from a single donor) from healthy donors were purchased from BioIVT (New York, USA) and stored in aliquots at -80ºC. For complement-preserved serum samples, blood was collected aseptically and processed within 1 hour. After coagulation at RT for 30–45 min., samples were centrifuged at 2,000 × g at 4 °C and serum was collected. Samples were stored at –80 °C until further analysis. For the calibrator, a serum pool with a known sTCC concentration was obtained from the Department of Immunology at the University of Oslo and Oslo University Hospital Rikshospitalet (Oslo, Norway) (21). This reference material was used to calibrate an internal serum pool by parallel testing and standard curve alignment. The resulting internally calibrated pool was subsequently used as the assay standard to ensure consistency across experiments.
Development of sTCC sandwich ELISA (HK328)
To enable specific and reliable quantification of sTCC in human plasma and serum, an ELISA was developed using the C9 neo-epitope-specific monoclonal antibody aE11. The assay consists of a 96-wells plate (MaxiSorpTM 96-wells plates, Thermo Fisher Scientific, Waltham, USA) coated with mAb aE11 (HM2167; Hycult Biotech, Uden, The Netherlands) to specifically capture sTCC. Plasma (EDTA, citrate and heparin) and serum samples were diluted at least 20 times in assay specific dilution buffer and, next to a calibrator, incubated in the precoated wells for 1h at RT. Following a four-step wash, wells are incubated for 1 hour with a biotinylated monoclonal anti-C6 antibody (9C4), recognizing the C6 protein incorporated in the sTCC complex. After an additional wash step, streptavidin-peroxidase conjugate was added and incubated for 1h allowing to bind the biotinylated detection antibody. TMB substrate was added, and the reaction was stopped after 30 min. using 2% (w/v) oxalic acid. The optical density (OD) was measured at 450 nm using a microplate reader (BioTek Synergy HT). Unless otherwise specified, this protocol was used to perform measurements and evaluate assay characteristics such as; specificity, sensitivity, linearity, recovery and intraand inter-assay variability. During development, variation between measurements or conditions was assessed by calculating the coefficient of variation (%CV) over multiple determinations of a single sample. Assay performance was evaluated according the following general requirements. For optimal dynamic range, the optical density at 450 nm for the highest standard (S1) was required to fall between 1.7 and 3.5, ensuring strong signal intensity without saturation. The blank was accepted only if OD450 ≤ 0.2 to confirm minimal background. A signal-to-noise ratio (S1/blank) above 10 was required to ensure sufficient assay sensitivity and discrimination. Precision was assessed by calculating the coefficient of variation (%CV) across at least three serial dilutions of the same sample, with a threshold of <15% considered acceptable for reliable quantification. These criteria align with common immunoassay validation standards and were used throughout assay development to confirm analytical robustness.
Immunoassay specificity and cross-reactivity
Specificity and cross-reactivity of the immunoassay was investigated using native purified C5, C6, C7, C8 and C9 (Complement Technology Inc., Texas, USA). Proteins were
added to the wells in a concentration of 1500 ng/mL in assay dilution buffer and obtained OD values were used to calculate concentrations. In addition, it was also investigated whether the assays cross-react with complement proteins from species other than human. The animal plasma samples (mouse, rat, pig, non-human primate NHP, horse, rabbit) were tested up to a ten-fold higher concentration than the recommended concentration for human plasma samples.
Recovery of sTCC complex in EDTA plasma samples
The recovery of sTCC in the assay was evaluated using EDTA plasma samples. Samples from different donors, exhibiting varying sTCC concentrations, were mixed in the following ratios: 100:0, 75:25, 50:50, 25:75, and 0:100. Each mixture was incubated for 30 minutes at RT. Subsequently, sTCC concentrations in the mixed samples were measured according to the previously described protocol. Recovery was determined for each mixture by comparing the measured concentration to the expected value,
calculated using the following equation:
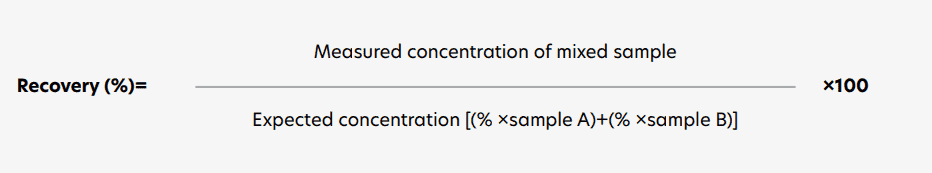
Requirements were met if recovery was between 80-100%
Intra-and inter assay variation and inter-batch variation
Intra-assay variation was assessed by repeated measurements of the same samples within a single ELISA plate. Inter-assay variation was determined by comparing results from the same samples tested independently by different operators in a blinded manner. Inter-batch variation was evaluated by testing the same samples across three independently producedassay batches. A %CV of ≤15% for intra- and inter-assay variation, and ≤20% for inter-batch variation, was considered indicative of low variability.
Statistical analysis
For statistical analysis and data visualization GraphPad Prism 9.5 was used. Non-linear regression (Sigmoidal Four Parameter-Logistic (4PL) curve fit) was used to determine the doseresponse curve and subsequently to determine the coefficient of determination (R2). One-way ANOVA followed by Tukey’s multiple comparisons test was used to compare the effect of different matrices. A p<0.05 was considered statistically significant (** p < 0.01, ‘ns’: non-significant).
Results
Assay characteristics and performance
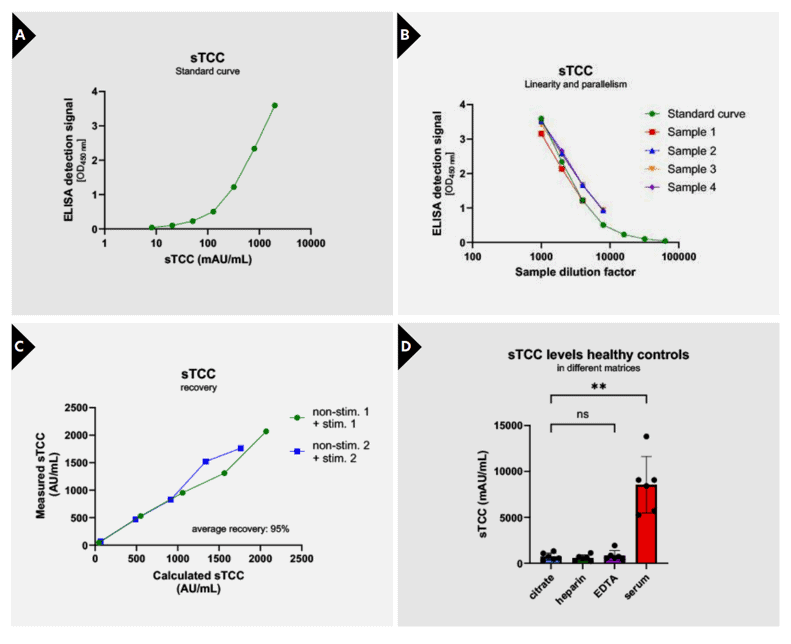
For enabling quantitative measurements of sTCC, a standard curve was created by calibrating a pool of zymosan-activated serum samples against a previously calibrated serum pool with a known sTCC concentration (21). Further experiments were performed using the internal produced serum pool as calibrator. Calibration was achieved using a seven-point standard curve with a dynamic range from 8.2 to 2000 mAU/mL, providing consistent and reproducible sigmoidal fits (Figure 2A). Curve progression is linear between 2000 and 51.2 mAU/mL (upper limit of quantification; ULoQ: 2000 mAU/mL, lower limit of quantification; LLoQ: 8.2 mAU/mL) and resulted in a coefficient of determination of R2 = 0.9986 between the measured OD450nm and the sTCC concentration (Figure 2A; Table 1). Linearity and parallelism were confirmed across serial
dilutions of EDTA plasma samples, aligning well with the standard curve and yielding CVs <15% across tested dilutions, indicating good linearity (Figure 2B).
To assess assay accuracy and reproducibility, recovery of the target analyte and intra- and inter-assay variation were evaluated. In addition, also inter-batch variation was assessed. Recovery was analysed in EDTA plasma samples with a known sTCC concentration by mixing them in different ratios: 100:0, 75:25, 50:50, 25:75 and 0:100. Results showed adequate recovery, with results ranging between 80 and 120% (Figure 2C, Table 1). Next, reproducibility was investigated by assessing intra-assay variation (variation of multiple measurements of the same sample in a single test run) and inter-assay variation (variation of multiple measurements of the same sample in several test runs performed by different operators). Results show low variability with intraassay %CVs ranging from 3.5–8.3% and inter-assay %CVs from 8.2–13.4%, well within accepted criteria (Table 1). Lastly, batch-to-batch variation over three independently produced batches was evaluated, showing inter-batch variation ranging from 3.1–16.3% (Table 1), highlighting the assay’s robustness and reproducibility over production lots.
To assess matrix effects, sTCC concentrations were measured in citrate plasma, heparin plasma, EDTA plasma and serum (CHES panel) from the same individual and compared to each other. In total, six CHES panels were assessed. sTCC concentrations could be accurately determined in both plasma matrices as in serum. Plasma concentrations did not differ between citrate, heparin, and EDTA samples. However, sTCC concentrations were significantly higher in serum compared to all plasma matrices (p=0.0011) (Figure 2D). Specificity of the assay was verified through crossreactivity testing, where no measurable signal was detected for purified complement components C5b, C6, C7, C8, or C9, confirming that only the assembled terminal complex is recognized (Table 1). Moreover, species cross-reactivity analysis revealed reactivity for non-human primate, pig, and rabbit samples, while no signal was detected in mouse, rat, or horse plasma, suggesting selective interspecies applicability (Table 1).
Evaluation of sTCC concentrations in samples treated with complement inhibitors
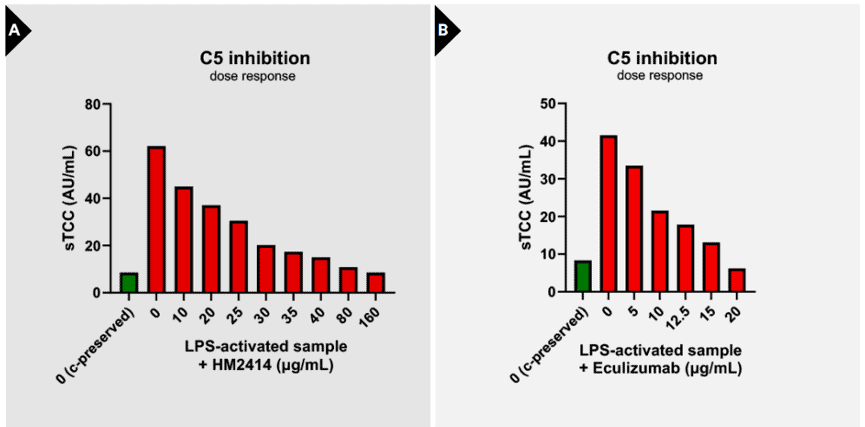
To investigate the applicability of sTCC as a marker to assess complement inhibition, sTCC levels were analyzed in activated serum samples pre-incubated with two C5-targeting inhibitors: HM2414 and Eculizumab. A clear dosedependent reduction in sTCC formation was observed upon treatment with either inhibitor. Pre-incubation with HM2414 resulted in a gradual and consistent decline in sTCC concentrations, indicating effective blockade of terminal pathway activation (Figure 3A). Similarly, Eculizumab dose-dependently suppressed sTCC generation (Figure 3B). These findings demonstrate the ability of the sTCC ELISA to sensitively detect pharmacodynamic effects of complement inhibition at the level of C5, supporting its use as a readout for therapeutic efficacy in both preclinical and clinical settings.
Bioanalytical Method Validation and Study Sample Analysis ICH M10 guidelines.
Discussion
The aim of the current study was to develop and validate a robust and specific immunoassay for the quantification of sTCC in human plasma and serum, enabling reliable assessment of terminal complement activation under physiological conditions. In summary, these data demonstrate that the sTCC ELISA is a reliable, precise, and highly specific tool for measuring sTCC levels in human plasma and serum, thereby enabling robust detection of terminal complement activation for research and clinical support
applications according to ICH M10 guidelines (see also Box 1). To facilitate comparability with international datasets and to enable interlaboratory comparability, the assay reports sTCC levels in arbitrary units (AU) rather than absolute concentrations. This approach not only aligns with the practices of the complement standardization group but also addresses the inherent complexity of the sTCC complex, whose variable stoichiometry and lack of a defined molecular standard limit the feasibility of accurate mass-based quantification. Use of AU, calibrated against a well-characterized internal reference, ensures consistency, assay robustness, and broader applicability across laboratories and study settings. This strategy also supports the development of international reference materials and harmonized validation reporting formats, which are critical for regulatory acceptance and broader clinical implementation (see also Box 1). With regard to its potential as a biomarker, the clinical and translational relevance of sTCC quantification has been extensively explored across a broad spectrum of complementmediated diseases and pathological conditions. Numerous studies reported that quantification of sTCC offers significant added value as a biomarker for complement activation, particularly in the context of disease onset, severity, and therapeutic response (18, 22, 23). As sTCC levels reflect the culmination of complement activation, thereby providing an integrated readout of terminal pathway activity, it serves as sensitive marker for identifying acute complementmediated pathology and stratifying disease severity in conditions such as neuromyelitis optica spectrum disorders (NMOSD) (23) , atypical hemolytic uremic syndrome (aHUS) (17), and transplant rejection (18). In addition, sTCC quantification also offers significant added value for assessing complement activity, in relation to therapeutic response and disease monitoring in patients receiving complement inhibitors (18, 22, 23). Dynamic changes in sTCC levels can be used to track pharmacologic effects during treatment with C5-targeting inhibitors such as eculizumab. As shown in the present study, dose-dependent reductions in sTCC concentrations upon inhibitor administration underscore its relevance for therapeutic monitoring and guiding dose adjustments (24). Beyond its role in monitoring patient response to approved complement inhibitors, sTCC also serves as a valuable marker for the assessment of novel complementtargeting therapies under development. The sTCC assay provides a robust and quantitative platform to evaluate the pharmacodynamic efficacy of novel complement inhibitors under development. By enabling sensitive monitoring of sTCC formation, the assay facilitates assessment of the extent and kinetics of terminal pathway inhibition in response to candidate compounds. This is essential for determining optimal dosing strategies, evaluating target engagement, and establishing proof-of-mechanism in early-phase studies. In compound screening programs, the assay can be used to compare the potency of multiple inhibitors by quantifying sTCC levels in activated serum or plasma samples treated with increasing drug concentrations. Moreover, in studies using patient-derived samples, the assay supports evaluation of compound efficacy in relevant biological matrices, helping to translate in vitro findings to clinically meaningful outcomes. The assay is also well-suited for assessing adverse events (AEs) linked to unintended complement activation, either due to investigational drug mechanisms or off-target effects, thus supporting safety profiling and risk mitigation strategies early in development. Importantly, the inclusion of sTCC as a biomarker has become increasingly common in clinical trials evaluating complement inhibitors. In some trials, sTCC serves as a critical diagnostic or stratification marker, such as in thrombotic microangiopathy (TMA; NCT03518203) and C3 glomerulopathy/aHUS (NCT05086744). In other studies, such as those on paroxysmal nocturnal hemoglobinuria (PNH; NCT03459443), systemic sclerosis (NCT03124368), and lupus nephritis, sTCC is included as an exploratory or secondary endpoint, reflecting its utility in capturing pharmacodynamic responses and supporting mechanistic insights.
Concluding remarks
The sTCC ELISA provides a robust and specific tool for the quantification of sTCC in human plasma and serum, enabling reliable assessment of terminal complement activation. By reporting results in AU, the assay aligns with international standardization practices and accommodates the structural complexity of the sTCC complex.
Beyond analytical performance, the assay demonstrates clear clinical and translational value. It supports the use of sTCC as a biomarker for disease severity and progression in complement-mediated conditions, and enables sensitive monitoring of complement inhibitor therapies. Additionally, it offers a practical tool for evaluating drug efficacy and detecting offtarget complement activation during early-phase drug development. Together, these characteristics make the sTCC ELISA a robust and wellvalidated tool for supporting fundamental and translational research, diagnostic applications, and complement-targeted drug development.
References
- Ricklin D, Hajishengallis G, Yang K, Lambris JD. Complement: a key system for immune surveillance and homeostasis. Nat Immunol. 2010;11(9):785-97.
- Merle NS, Church SE, Fremeaux-Bacchi V, Roumenina LT. Complement System Part I – Molecular Mechanisms of Activation and Regulation. Front Immunol. 2015;6:262.
- Muller-Eberhard HJ. The membrane attack complex of complement. Annu Rev Immunol. 1986;4:503-28.
- Botto M, Kirschfink M, Macor P, Pickering MC, Wurzner R, Tedesco F. Complement in human diseases: Lessons from complement deficiencies. Mol Immunol.
2009;46(14):2774-83. - Merle NS, Noe R, Halbwachs-Mecarelli L, FremeauxBacchi V, Roumenina LT. Complement System Part II: Role in Immunity. Front Immunol. 2015;6:257.
- Morgan BP, Boyd C, Bubeck D. Molecular cell biology of complement membrane attack. Semin Cell Dev Biol. 2017;72:124-32.
- Morgan BP, Walters D, Serna M, Bubeck D. Terminal complexes of the complement system: new structural insights and their relevance to function. Immunol Rev.
2016;274(1):141-51. - Barnum SR, Bubeck D, Schein TN. Soluble Membrane Attack Complex: Biochemistry and Immunobiology. Front Immunol. 2020;11:585108.
- Hadders MA, Bubeck D, Roversi P, Hakobyan S, Forneris F, Morgan BP, et al. Assembly and regulation of the membrane attack complex based on structures of C5b6
and sC5b9. Cell Rep. 2012;1(3):200-7. - Hadders MA, Beringer DX, Gros P. Structure of C8alpha-MACPF reveals mechanism of membrane attack in complement immune defense. Science.
2007;317(5844):1552-4. - Menny A, Serna M, Boyd CM, Gardner S, Joseph AP, Morgan BP, et al. CryoEM reveals how the complement membrane attack complex ruptures lipid bilayers. Nat Commun. 2018;9(1):5316.
- Sharp TH, Koster AJ, Gros P. Heterogeneous MAC Initiator and Pore Structures in a Lipid Bilayer by Phase-Plate Cryo-electron Tomography. Cell Rep.2016;15(1):1-8.
- Niculescu F, Badea T, Rus H. Sublytic C5b-9 induces proliferation of human aortic smooth muscle cells: role of mitogen activated protein kinase and
phosphatidylinositol 3-kinase. Atherosclerosis. 1999;142(1):47-56. - Bayly-Jones C, Bubeck D, Dunstone MA. The mystery behind membrane insertion: a review of the complement membrane attack complex. Philos Trans R Soc Lond B
Biol Sci. 2017;372(1726). - Couves EC, Gardner S, Voisin TB, Bickel JK, Stansfeld PJ, Tate EW, et al. Structural basis for membrane attack complex inhibition by CD59. Nat Commun. 2023;14(1):890.
- Xie CB, Jane-Wit D, Pober JS. Complement Membrane Attack Complex: New Roles, Mechanisms of Action, and Therapeutic Targets. Am J Pathol. 2020;190(6):1138-50.
- Riedl M, Hofer J, Giner T, Rosales A, Haffner K, Simonetti GD, et al. Novel biomarker and easy to perform ELISA for monitoring complement inhibition in patients with
atypical hemolytic uremic syndrome treated with eculizumab. J Immunol Methods. 2016;435:60-7. - Budkowska M, Ostrycharz E, Serwin NM, Nazarewski L, Cecerska-Heryc E, Porecka M, et al. Biomarkers of the Complement System Activation (C3a, C5a, sC5b-9) in Serum of Patients before and after Liver Transplantation. Biomedicines. 2023;11(7).
- Bayly-Jones C, Ho BHT, Lau C, Leung EWW, D’Andrea L, Lupton CJ, et al. The neoepitope of the complement C5b-9 Membrane Attack Complex is formed by proximity of adjacent ancillary regions of C9. Commun Biol. 2023;6(1):42.
- Brandwijk R, Michels M, van Rossum M, de Nooijer AH, Nilsson PH, de Bruin WCC, et al. Pitfalls in complement analysis: A systematic literature review of assessing complement activation. Front Immunol. 2022;13:1007102.
- Mollnes TE, Lea T, Froland SS, Harboe M. Quantification of the terminal complement complex in human plasma by an enzyme-linked immunosorbent assay based on
monoclonal antibodies against a neoantigen of the complex. Scand J Immunol. 1985;22(2):197-202. - Baillie K, Davies HE, Keat SBK, Ladell K, Miners KL, Jones SA, et al. Complement dysregulation is a prevalent and therapeutically amenable feature of long COVID.
Med.2024. - Miyamoto K, Murakami K, Sakata M, Nakayama Y, Kuwahara M, Inoue N. Predictive complement biomarkers for relapse in neuromyelitis optica spectrum disorders. Mult Scler Relat Disord. 2025;94:106282.
- Mizuno K, Dandoy CE, Teusink-Cross A, Davies SM, Vinks AA, Jodele S. Eculizumab precision-dosing algorithm for thrombotic microangiopathy in children and young
adults undergoing HSCT. Blood Adv. 2022;6(5):1454-63.